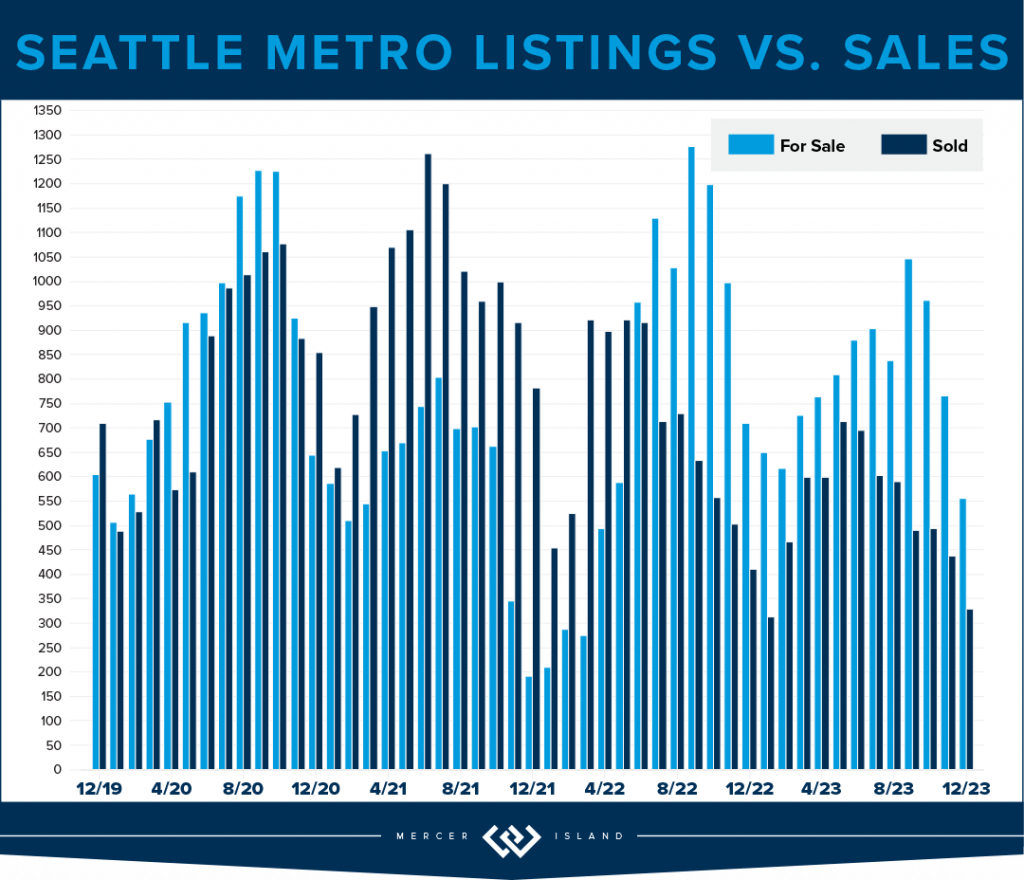
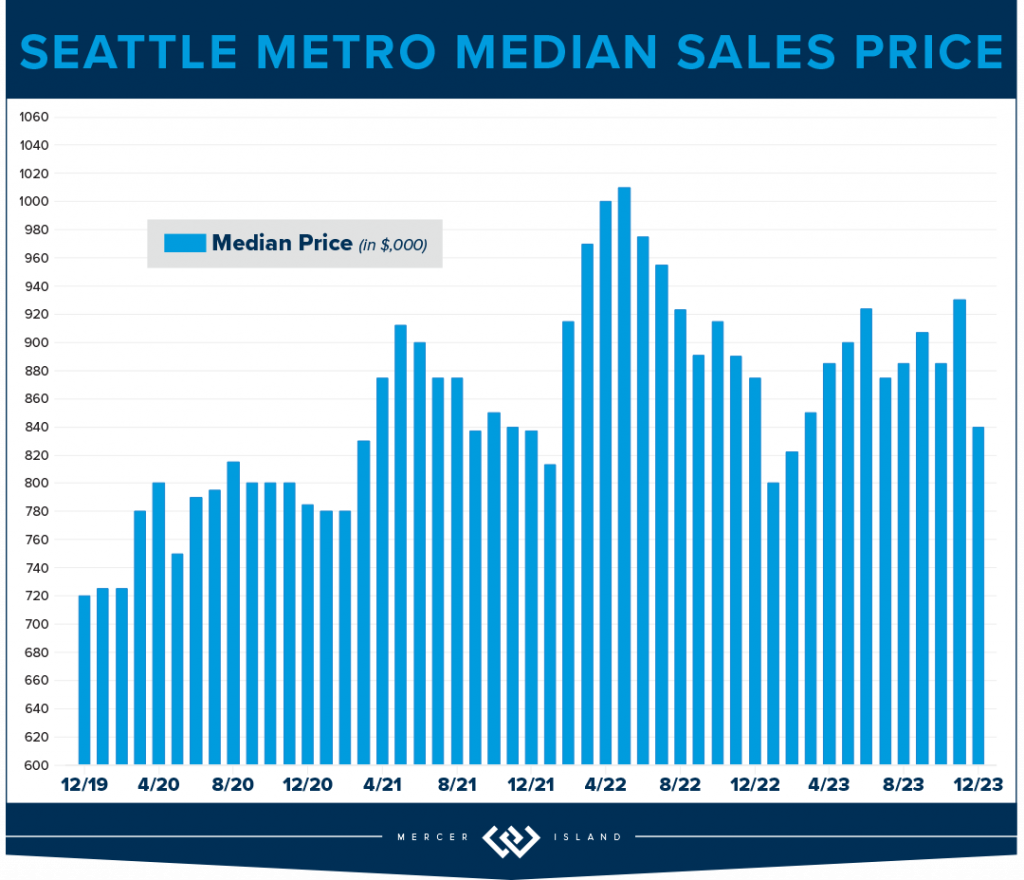
Median home sales prices across the region saw a year-over-year dip compared to 2022, with prices settling just above their 2021 levels. That being said, most homes still sold within the first 10 days on the market and either at or above the listing price. Today’s higher rates, in concert with constricted inventory, have slowed the total number of sales. Should rates ease like experts are predicting, however, we will see more people enter the market and hopefully more listings will follow. (Read more about that in our full 2024 forecast).
Click or scroll down to find your area report:
Seattle | Eastside | Mercer Island | Condos | Waterfront
SEATTLE
Would you like the good news or the bad news? Bad: Overall home prices slid in the city by 7%. Good: 57% of all homes sold in the first 10 days and for 104% of list price. While we may have backed off of our head spinning pandemic list/sale percentages, we’re still going strong. To us what this means is: if you’re considering selling there is probably a buyer ready and waiting to make you an offer. It just won’t be quite as lucrative as it might have been in 2022. It could be a lot worse given the high cost of money in 2023. Homeowners certainly came out ahead and Seattleites have our chronically low inventory and stable job market to thank for this!
We finished the year with sales down 23%, a figure made a lot less scary by the fact that listings were also down city wide by 24%. North Seattle east of I-5 saw the most stable prices, only losing 2% at a median price of $976,000. Queen Anne/Magnolia lost 10%, closing out the year at $1,263,000. It’s also interesting to note that 65% of homes sold for list price or better. This means we have mostly well counseled homeowners with reasonable expectations of what the market will bear.
If you’re in the market for a new home in 2024, Q1 is a great time! Inventory hasn’t been this low since 2012. If the cost of money goes down—as many experts are predicting—and more people decide to purchase, it could get very competitive very quickly! Beat the rush!
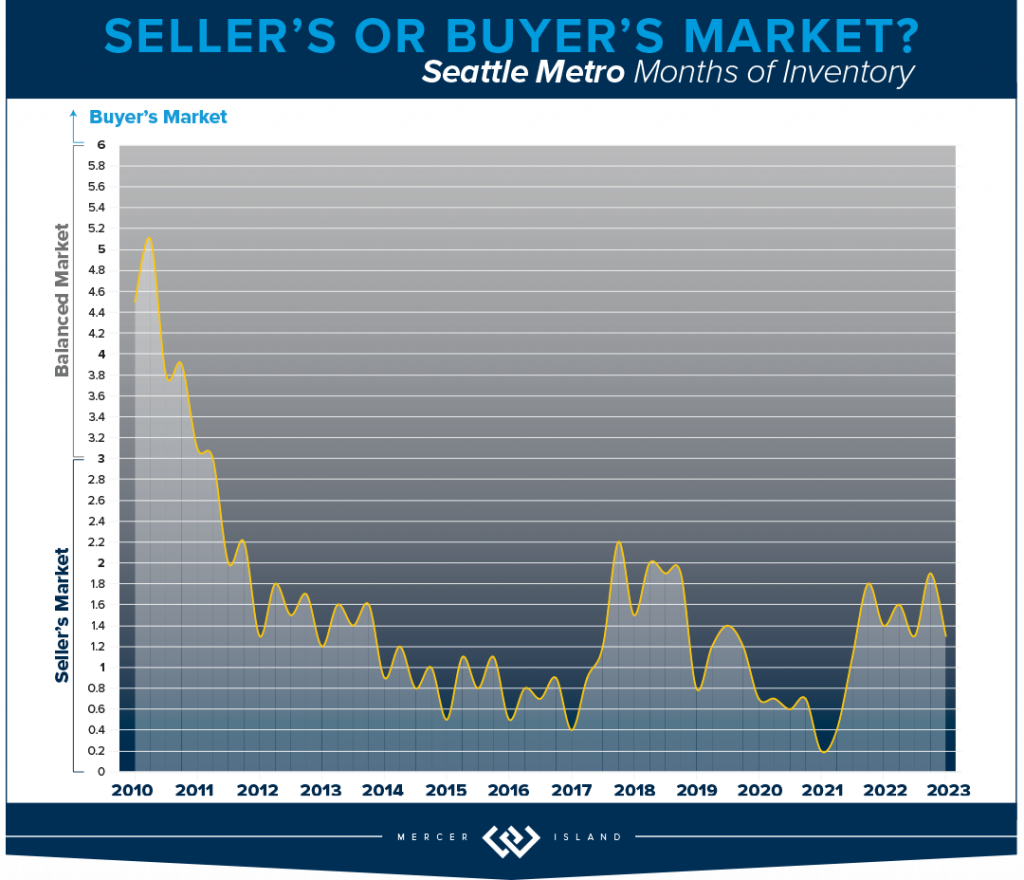
Click here for the full report and neighborhood-by-neighborhood statistics!
EASTSIDE
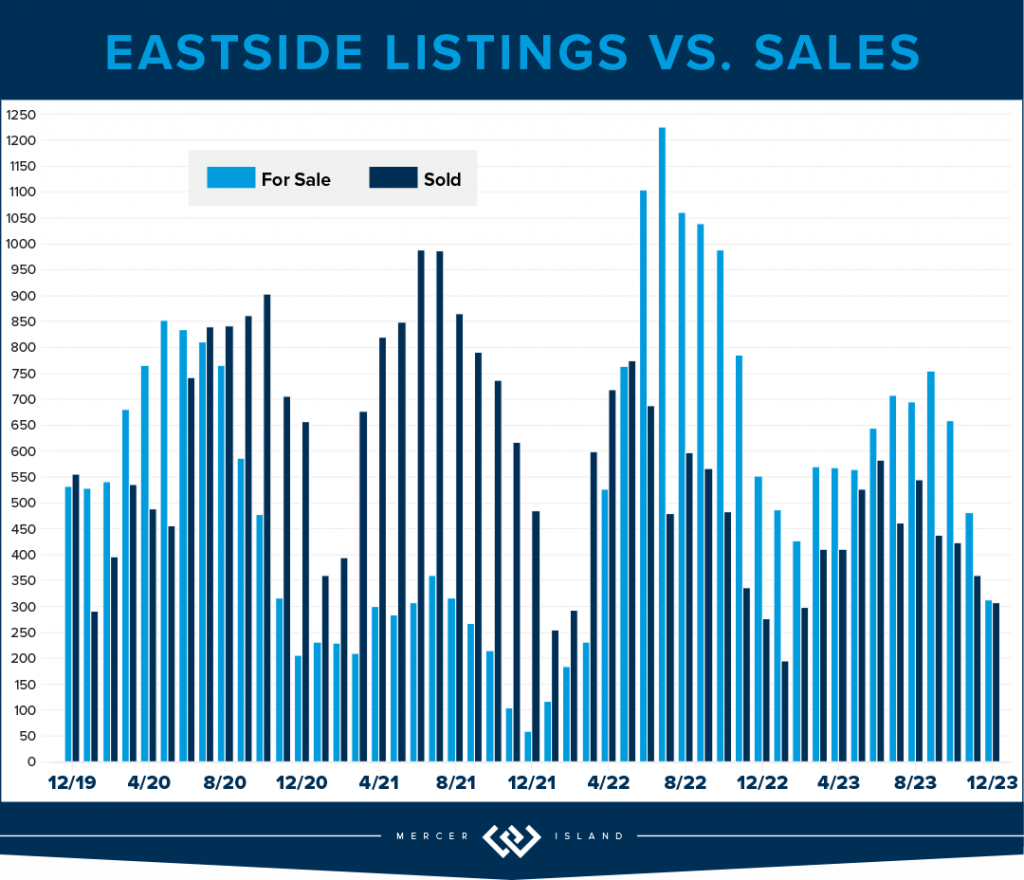
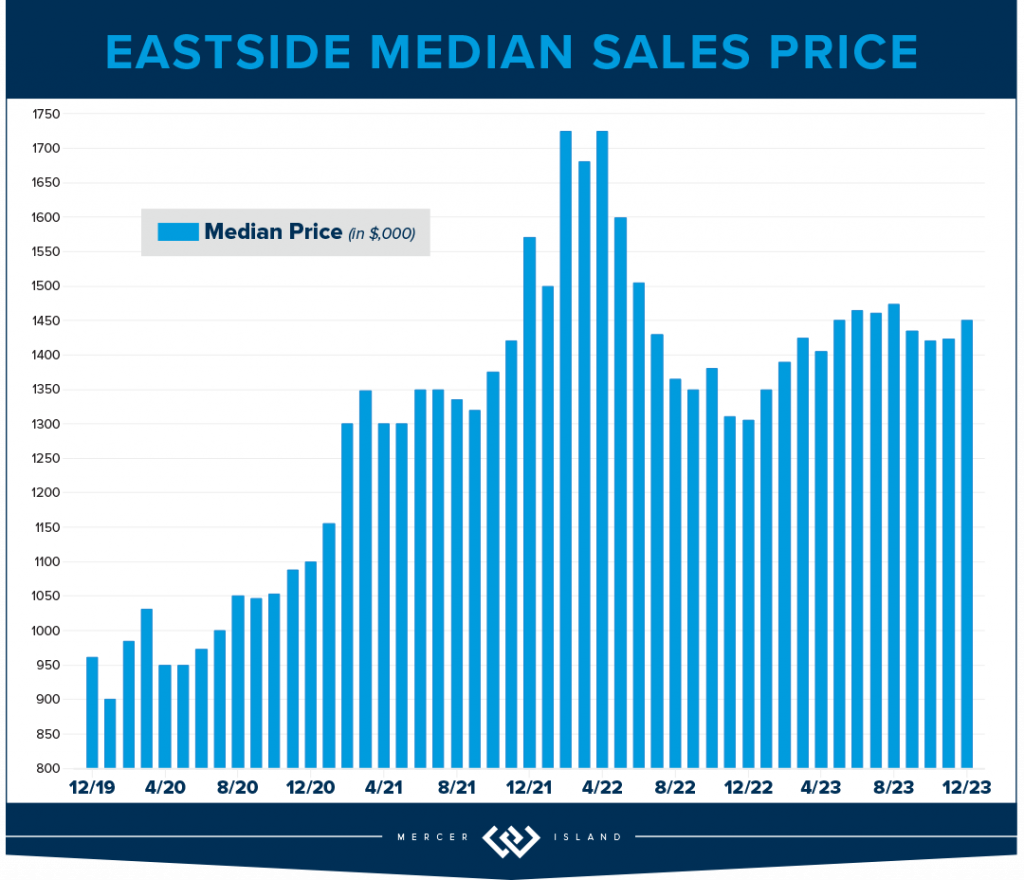
The Eastside median sales price was down by 4% as we closed out 2023. This is in large part due to the interest rates. It certainly isn’t supply and demand: Total listings were down 29% while sales only dipped 18% YOY. That’s staggering. Buyers and Sellers did not seem to be aligned in their estimation of the market: only 55% of homes sold for at or above list price while 45% needed a reduction or negotiation prior to accepting an offer. While this sounds balanced, it’s out of the norm compared to our historic data.
Sammamish was the strongest overall area with a whopping 1217 sales (25% of the total 4954) and the lowest median price dip of 3%; $1,400,000 in 2023 v. $1,450,000 in 2022. Mercer Island was the hardest hit with a 12% drop in median price to $2,239,000—the lowest since 2020. Corrections are healthy for the long-term health of a real estate market. We’re not sure how long this one will last; all signs are pointing to continued low inventory. It seems to be a game of chicken with the interest rates that could lead to massive pent-up demand.
If you’re in the market for a new home in 2024, Q1 is a great time! Inventory is at its absolute 15 year low (6,140 listings compared to a high of 10,880 in 2010) which means we are poised for a market flip. If the cost of money goes down—as many experts are predicting—and more people decide to purchase, it could get very competitive very quickly! Beat the rush!
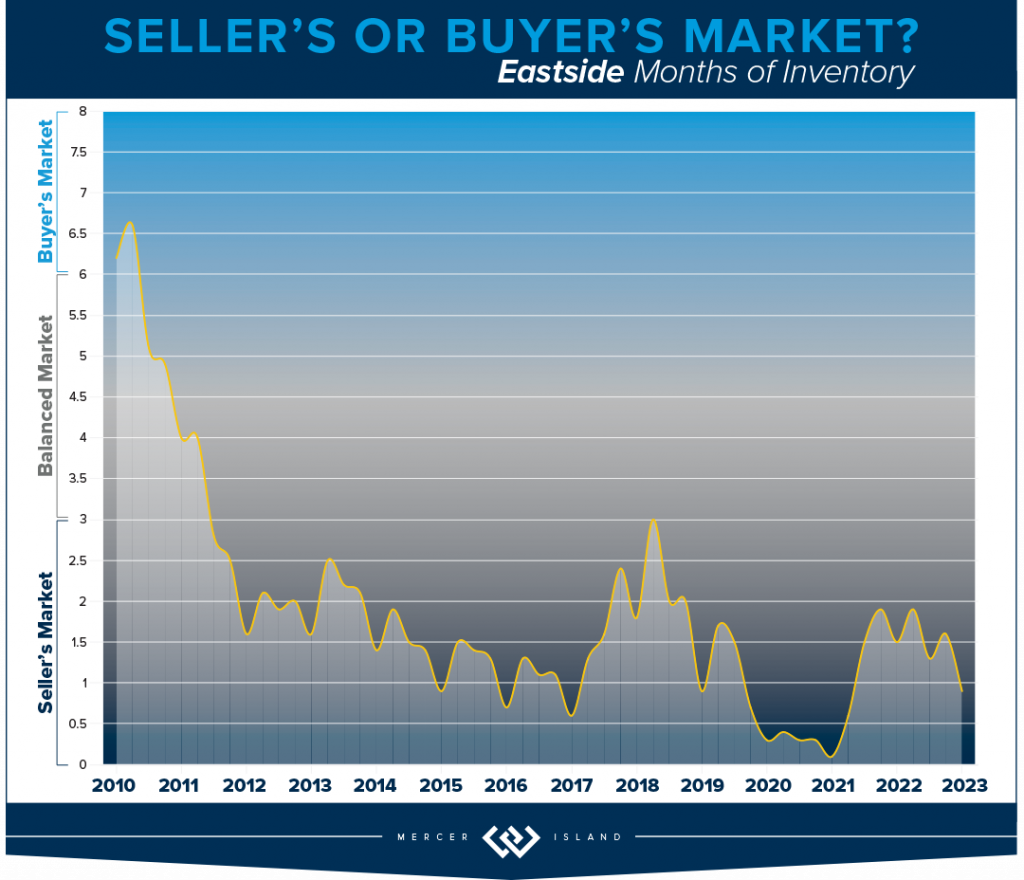
Click here for the full report and neighborhood-by-neighborhood statistics!
MERCER ISLAND
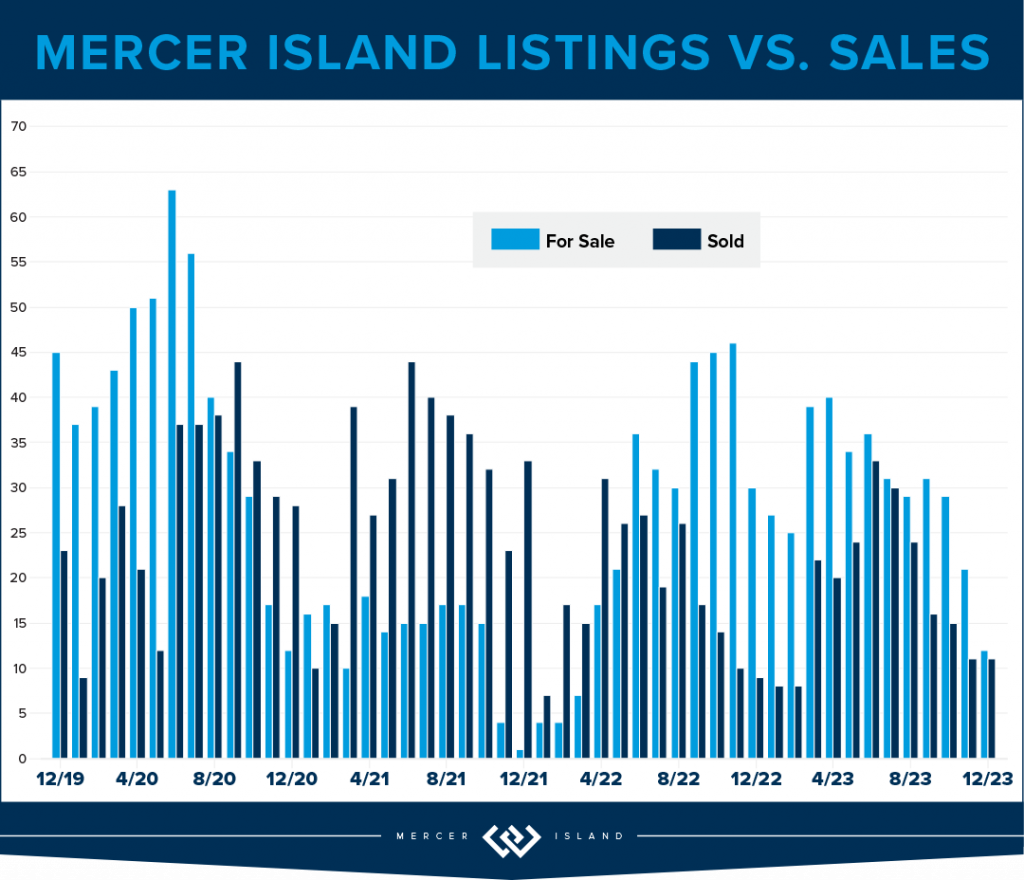
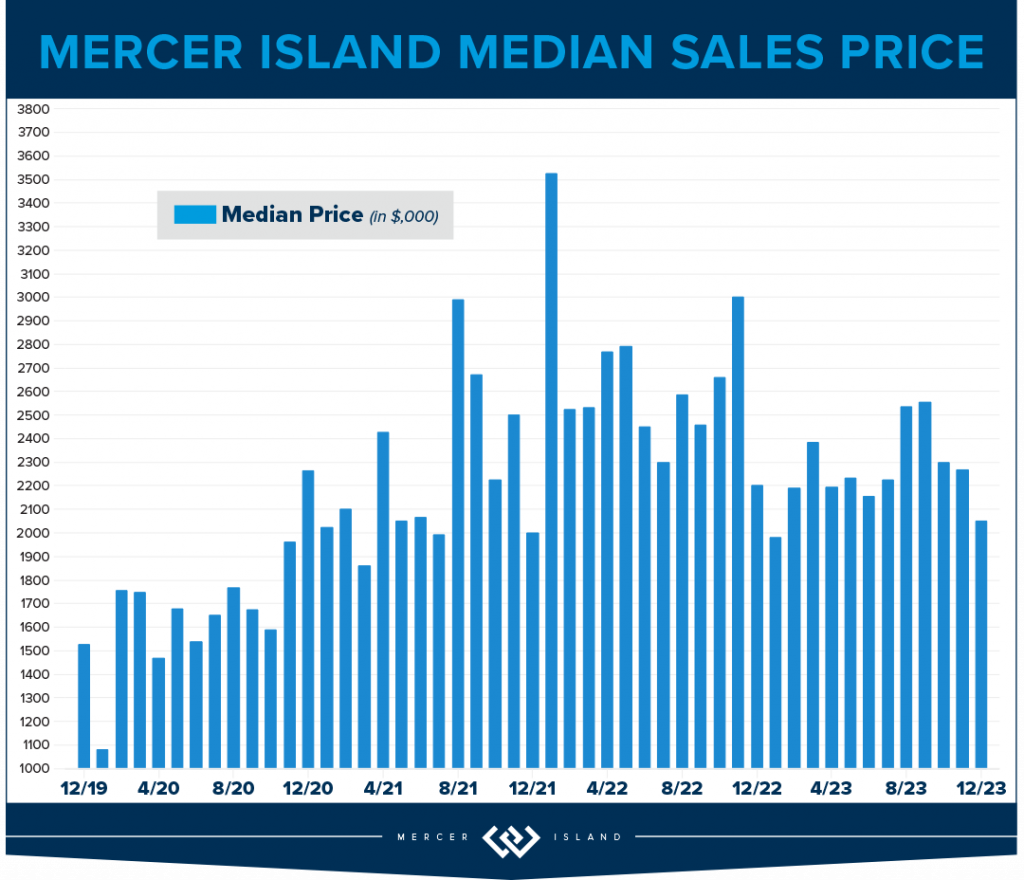
The Island saw just 289 new listings last year, only 60% of the peak 488 in 2013. There are some numbers that show we had very realistic homeowners in 2023: a 78% absorption of listings, (222 sales, up from 218 in 2022) and 98% list/sale price. When buyer and seller expectations meet, magic happens. The median price in 2023 was $2,239,000 back to around the same level as 2021—if you remember, this was a 30% increase from $1,700,000 in 2020.
Condos on the Island are off 8% to $620,000 from the 2022 high of $674,000, this is a strong showing. For the previous 4 years (2018-21) median prices were in the $500’s. There were only 33 sales Island-wide, the lowest number of total sales in 15 years. Listings were down as well: the lowest level since 2012. The metrics show that the market was strong, even with the dip in median sales price: 19 days on market, 99% list/sale price ratio, on average only 4 listings were active at one time. These are all signs of a constricted inventory/sellers’ market, which is what will eventually drive prices higher.
All in all, MI is holding strong to the price gains made during the pandemic. We are bullish on our market in 2024 as interest rates are easing. Time will tell.
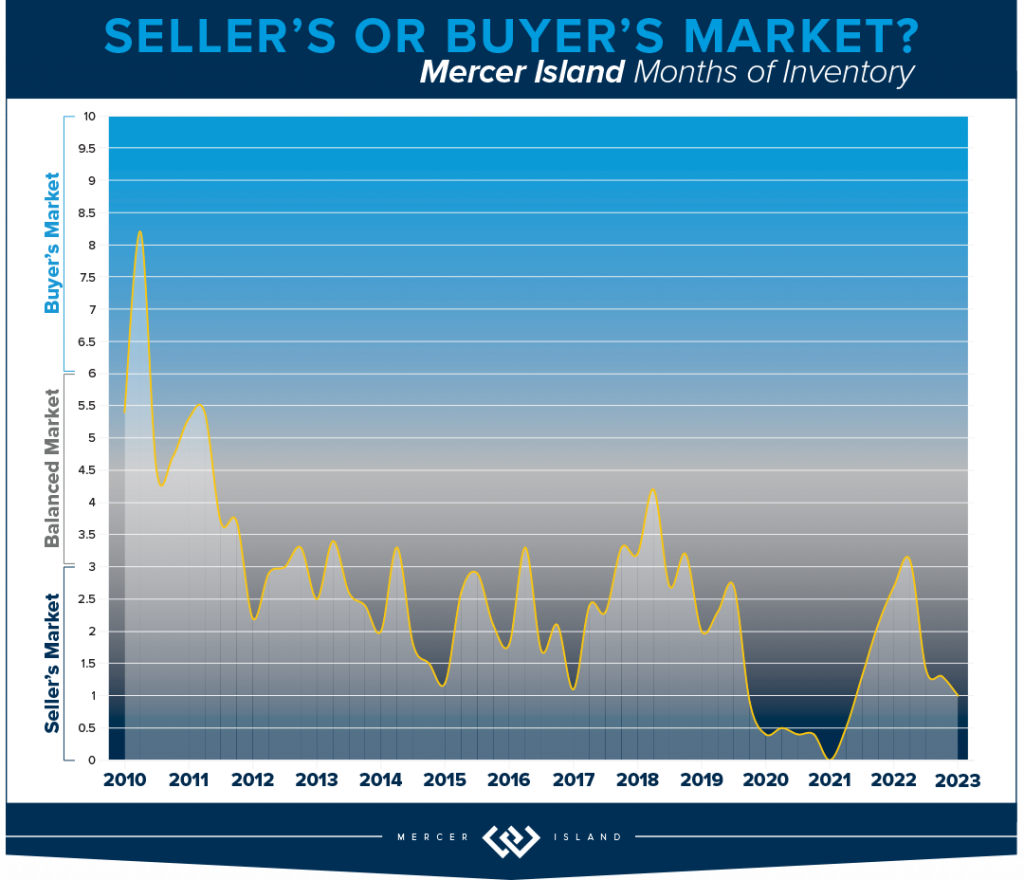
Click here for the full report and neighborhood-by-neighborhood statistics!
CONDOS – SEATTLE & EASTSIDE
Whew! What a year! The major condo headline for both Eastside and Seattle condos: Prices hold steady while demand dips 25%! While this is sensationalized, it’s true. Likely due to the fact that inventory was also down by 20%, which means that supply and demand remained aligned and shielded homeowners from what could have been a massive hit to their bottom lines.
On the Eastside, when the dust settled, prices are down by 1%. The largest drop in median price was East Bellevue losing 11% while Kirkland soared above all other neighborhoods with double digit gains (up 19%). Other areas of note: West Bellevue topped the charts with a median sale price of $880,000! This is higher than the $876,000 residential median sale price in the city of Seattle.
Speaking of Seattle, the condo market in the city reminds us of The Little Engine That Could. Chugging merrily along despite having the odds stacked against it: I think I can! Overall, the city posted a 5% gain year over year with record high median sales price of $546,000. Downtown saw the highest overall unit volume at 439 total sales, while Greenlake/Ballard boasted the highest overall gain in median price at 15% appreciation. All good news, finally.
Check out area-by-area details the full condo report.
WATERFRONT
While Seattle and the Eastside both posted fewer waterfront sales in 2023 than in 2022, Lake Sammamish saw a big 40% year-over-year jump in sales. Mercer Island’s sales increased by a more modest 10%.
The highest waterfront sale of 2023 was $20 million for a breathtaking Evergreen Point estate on 115 feet of prime low-bank shoreline. Listed by Windermere and truly unique with a custom home designed by Hal Levitt, it sold its first day on the market (and well above the $18.5m asking price!).
The most modest waterfront sale was a 1,749 sq. ft. Lake Sammamish home sold by the owner for $1.62 million. It featured 25 feet of lakefront and big lake/mountain views.
Click here for the full waterfront report with top sales for the entire Seattle-Eastside private waterfront market, including Mercer Island and Lake Sammamish. The data is interesting and insightful (but cannot replace an in-depth waterfront analysis with your trusted professional).

We earn the trust and loyalty of our brokers and clients by doing real estate exceptionally well. The leader in our market, we deliver client-focused service in an authentic, collaborative, and transparent manner and with the unmatched knowledge and expertise that comes from decades of experience.
© Copyright 2024, Windermere Real Estate/Mercer Island. Information and statistics derived from Northwest Multiple Listing Service and Trendgraphix, and deemed accurate but not guaranteed. Seattle cover photo courtesy of Team RAREnorthwest and Baylee Reinert with Clarity NW Photography. Eastside cover photo courtesy of Donna Cowles and Kelly Morrissey with Clarity NW Photography. Mercer Island cover photo courtesy of the Oordt Ceteznik Realty Group and Clarity NW Photography. Condo cover photo courtesy of Fred Fox and Brandon Larson with Clarity NW Photography. Waterfront cover photo courtesy of Anni Zilz and Andrew Webb with Clarity NW Photography.

 Facebook
 X
X
 Pinterest
 Copy Link

